
The Cost of a Frozen Tariff: Over-Quota Imports and the U.S. Sugar Market
- ARPC NDSU

- May 13
- 5 min read
Updated: May 15
By Shawn Arita, Ming Wang, and Sandro Steinbach
The Problem
The United States operates a managed sugar trade system, built around tariff-rate quotas and a residual- supplier arrangement with Mexico, designed to maintain stable market conditions for domestic producers in a heavily managed global market. After functioning for roughly two decades, the protective architecture has lost much of its intended effect. The over-quota tariff that anchored the system has lost about half of its real value to inflation, and over-quota sugar from foreign producers, primarily Brazil, has surged into the U.S. market. The result is a sustained drop in domestic prices and roughly $0.9 to $1.5 billion in lost producer revenue per year during FY2025 and FY2026. This brief explains how the system was designed to work, what changed, and why current conditions are likely to persist in the absence of a policy response.
A Tariff Set in 2000 Applied to a Different Economy
The over-quota tariff on raw sugar was set at 15.36 cents per pound under the Uruguay Round agreements and has not been adjusted since 2000. Because the tariff is written as a fixed cents-per-pound figure rather than a percentage of the import price, inflation has eroded its protective value. By 2025, the real value of the tariff had fallen by approximately 49 percent. Figure 1 illustrates the gap.
Figure 1: The Frozen Tariff: 25 Years of Inflation Erosion.
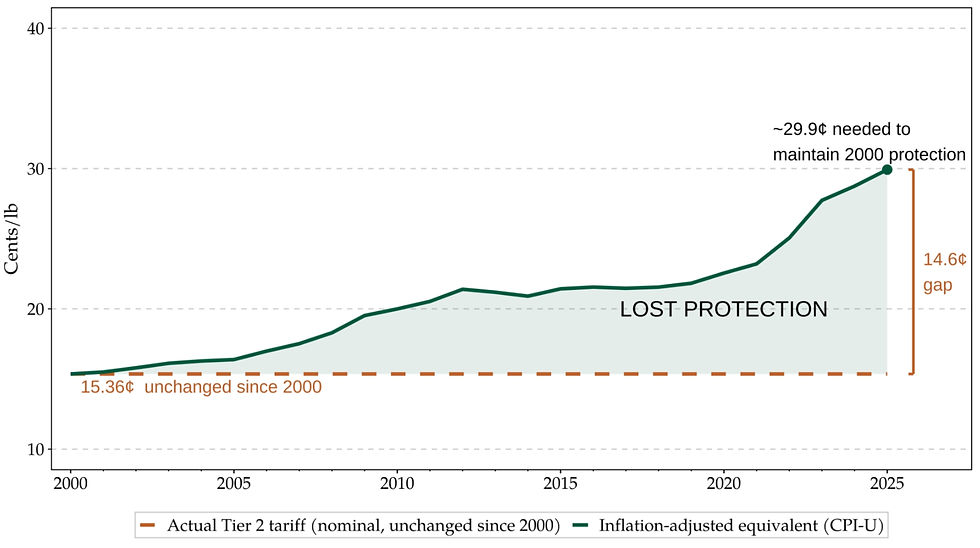
Note: The gap between the nominal tariff and its inflation-adjusted equivalent shows the erosion of protection over time.
Source: NDSU-ARPC using data from U.S. tariff schedule (19 U.S.C. § 1202, HTS 1701.14), and U.S. Bureau of Labor Statistics Sugar CPI-U.
The Protective Margin Collapsed
As the tariff lost real value, the gap between U.S. and world sugar prices narrowed below the level needed to keep over-quota imports out of the market. For most of the past three decades, that gap was wide enough to deter over-quota entry. Around 2022, it began to close, and over-quota trade became commercially viable for the first time since the Uruguay Round. Figure 2 shows the long-run pattern. The green bars in the lower panel mark years in which the protective margin exceeded 15 cents per pound, the threshold at which Tier 2 trade becomes profitable.
Figure 2: Ending S/U and the Needs Formula Before and After the Tier 2 Surge.

Note: After the Tier 2 surge, the ending stocks-to-use ratio rose noticeably above the 13.5% target.
Source: NDSU-ARPC using data from USDA ERS Sugar and Sweeteners Yearbook.
What Changed in the Market
The U.S. sugar program draws on five supply sources: domestic production, WTO tariff-rate quota imports, free trade agreement and re-export imports, Mexican supply under the bilateral Suspension Agreements, and the Tier 2 over-quota channel. The first four are governed by treaty obligations or administered allocations that hold their volumes relatively fixed. Mexico is the residual supplier, with its allocation set quarterly through a formula known as the Needs Formula. The formula targets a 13.5 percent ending stocks-to-use ratio, which is the level at which the system maintains a reasonable balance between supply and demand. While Tier 2 imports remained negligible, the system worked as designed. As over-quota volumes grew from roughly 10,000 short tons raw value (STRV) per year before 2018 to a record 1.2 million STRV in FY2024, the system was no longer able to absorb the inflows. Figure 3 compares the supply composition in FY2017, the last pre-surge year, with FY2024, the peak.
Figure 3: U.S. Sugar Supply Architecture: Five Sources, Two Eras.

Note: FY2017 is the last pre-surge year with negligible over-quota imports and ending S/U near the 13.5% policy target. FY2024 is the peak post-surge year.
Source: NDSU-ARPC illustration.
Why a Shift in the Source of Imports Matters
Total imports during the post-surge period have stayed within their normal range of roughly 3.2 to 3.8 million STRV. What changed is where they come from, and that distinction matters because the two channels behave very differently. Mexican sugar arrives on a fixed schedule at negotiated reference prices that do not respond to U.S. market conditions. Tier 2 sugar arrives whenever the U.S. price exceeds the world price plus the tariff and shipping costs. The Mexican channel stabilizes the market. The Tier 2 channel caps the U.S. price from above. Replacing one with the other has two consequences for domestic producers. Prices cannot recover even when supplies tighten, because any meaningful price increase invites more arbitrage-driven entry. At the same time, ending stocks have built up well above the 13.5 percent target, reaching 19.9 percent in FY2025, which depresses prices through inventory pressure. Figure 4 traces the feedback loop that connects these effects.
Figure 4: The Needs Formula Feedback Loop.

Note: Illustrates how erosion of the over-quota tariff translates into a sustained price depression in the domestic market.
Source: NDSU-ARPC illustration based on USDA suspension agreement procedures.
The Economic Cost
Tier 2 imports have depressed U.S. raw sugar prices by approximately 5 to 8 cents per pound during FY2025 and FY2026. Applied to roughly 18.7 billion pounds of annual U.S. production, the price effect translates into 0.9to1.5 billion in lost producer revenue per year. The injury falls disproportionately on the refined beet segment, which accounts for about 55 percent of domestic production and competes most directly with the refined share of Tier 2 imports. When the refined-market price effect is included, total industry losses rise to between $1.3 and $1.8 billion per year, with the sugar beet segment absorbing the larger share. Figure 5 summarizes the headline results. Full derivation, sensitivity analysis, and validation are presented in the companion white paper (Arita et al., 2026).
Figure 5: Estimated Effects of Removing Tier 2 Imports, FY2024–FY2026.

Note: The figure reports the headline results from the static partial equilibrium model for FY2024–FY2026.
Source: NDSU-ARPC.
What Happens Next
The conditions that drove the Tier 2 surge remain in place. Global sugar markets are projected to stay in surplus through 2027. Brazil, which has been the source of about 80 percent of recent over-quota volume, retains a structural cost position supported by its ethanol-blending mandate and a weak currency, with cane producers able to deliver sugar at roughly 15 to 16 cents per pound. Following the Supreme Court’s February 2026 decision invalidating the IEEPA tariff authority, the temporary 10 percent ad valorem surcharge under Section 122 of the Trade Act is currently the only barrier above the long-standing Tier 2 rate. That surcharge expires around July 24, 2026. After that date, the effective duty on over-quota entry will revert to the same 15.36-cent tariff that was in place during the FY2024 peak of over 1.2 million STRV. Within three weeks of the Court’s ruling, USDA’s March WASDE revised its Tier 2 projections upward by 134,000 STRV, indicating that the arbitrage incentive remains intact. Absent a policy response, the price and revenue effects estimated here are likely to persist.
References
Arita, Shawn, Ming Wang, and Sandro Steinbach (2026). Quantifying the Price Effects of Over-Quota Sugar Imports on the U.S. Domestic Market. ARPC White Paper 2026-07. Agricultural Risk Policy Center, North Dakota State University.


Comments