
A Horse Race Comparison of County-Level Crop Yield Prediction Methods
- ARPC NDSU

- Nov 20, 2025
- 4 min read
By Junkan Li and Francis Tsiboe
Reliable crop yield prediction is essential for agricultural outlooks, market assessments, and risk management. In the United States, the USDA’s National Agricultural Statistics Service (NASS) provides official yield estimates through survey programs, but complementary statistical and modeling approaches are increasingly used to enhance spatial and temporal coverage. County-level prediction is particularly valuable for understanding local variability, identifying climate sensitivities, and improving early-season forecasts.
A wide range of statistical and process-based approaches has been developed for crop yield prediction. The simplest methods rely on historical averages, such as county or state mean yields, which provide stable long-term benchmarks but often fail to capture interannual fluctuations driven by weather and other shocks. More advanced frameworks account for spatial and temporal dependencies, such as models incorporating spatial lags that represent regional linkages, or time-trend and autocorrelation terms capturing persistence in yields over time. Other extensions include incorporating weather variables, which represent the influence of precipitation and temperature on annual yield outcomes. Despite their theoretical appeal, it remains unclear whether these more complex methods consistently deliver substantial predictive consistently deliver substantial predictive gains over simple historical averages, especially at the county level, where sample sizes are limited and agro-climatic conditions are highly heterogeneous.
Table 1. Model Performance Comparison Based on Relative RMSE
Model Specification | Corn | Cotton | Soybeans |
County Mean (Baseline) | 1.000 | 1.000 | 1.000 |
State Mean | 1.265 | 1.207 | 1.207 |
Spatial Lag Mean | 1.041 | 1.041 | 1.029 |
Time Trend + Autocorrelation | 1.024 | 1.101 | 1.006 |
First Difference | 1.054 | 1.104 | 1.047 |
Time Trend + Autocorrelation (15-Year Sample) | 1.054 | 1.101 | 1.044 |
Time Trend + Autocorrelation + Weather Data (15-Year Sample) | 1.054 | 1.102 | 1.044 |
Note: The table reports the relative root mean squared error (RMSE) of each model. Values are normalized such that the model with the lowest RMSE equals 1. Lower values indicate better predictive performance.
Source: Agricultural Risk Policy Center (ARPC), using data from the U.S. Department of Agriculture, National Agricultural Statistics Service (USDA NASS).
This analysis combines county-level yield data from the USDA National Agricultural Statistics Service (NASS) with county-level weather data from the PRISM Climate Group. The evaluation period spans 2015–2024. For each year of this test window, the preceding 35 years of historical yield and weather observations are used to estimate model specifications enabling out-of-sample prediction. To ensure comparability across models, this study uses an automated selection algorithm to determine the optimal lag structure based on the Akaike Information Criterion (AIC). Model performance is assessed using root mean squared error (RMSE), normalized relative to the best-performing model in each crop category. Table 1 summarizes relative RMSEs across all model specifications, providing a direct comparison of predictive accuracy among alternative approaches.
Model performance is generally similar across most specifications, except for those relying solely on state-level historical yields, which perform substantially worse. Unexpectedly, the simplest models, those based on the average of recent county-level yields, consistently achieve the lowest prediction errors. This indicates that a strong in-sample fit does not necessarily translate into superior predictive performance. The small gains from more complex models underscore the substantial uncertainty in crop production driven by factors that are weakly predictable from historical yield patterns, such as weather shocks, pest pressures, and management variability. These results hold across all three crops: models utilizing recent county-level yield information consistently outperform more complex alternatives. In particular, the three-year average of past yields is most accurate for corn and soybeans, while the five-year average performs best for cotton.
Figure 1 presents the predicted 2025 crop yields (left column) and their changes relative to 2024 (right column). In 2024, states such as North Dakota, Illinois, and Arkansas benefited from well-timed rainfall and generally favorable growing conditions, resulting in record or near-record soybean and corn yields. Because these exceptional conditions are unlikely to persist, our model projects modest yield declines in these states for 2025. In contrast, Minnesota experienced a wet spring that limited suitable fieldwork days, while Tennessee and Ohio suffered late-season heat and dryness, leading to lower yields in 2024. As weather conditions normalize, yields in these states are expected to rebound in 2025. Moreover, Hurricane Helene caused flooding and harvest disruptions in Georgia, Alabama, and South Carolina in late 2024, particularly affecting soybeans and cotton; thus, recovery in 2025 is anticipated. Texas remains exposed to long-run water scarcity and high-temperature risks, particularly in the High Plains, but improved mid-season moisture resulted in higher cotton yields in 2024 compared with 2023 and 2022. Given the persistence of structural drought risk, our model forecasts a slight decline in Texas cotton yields in 2025 relative to 2024.
Figure 1. Predicted county-level crop yields for 2025 and changes relative to 2024
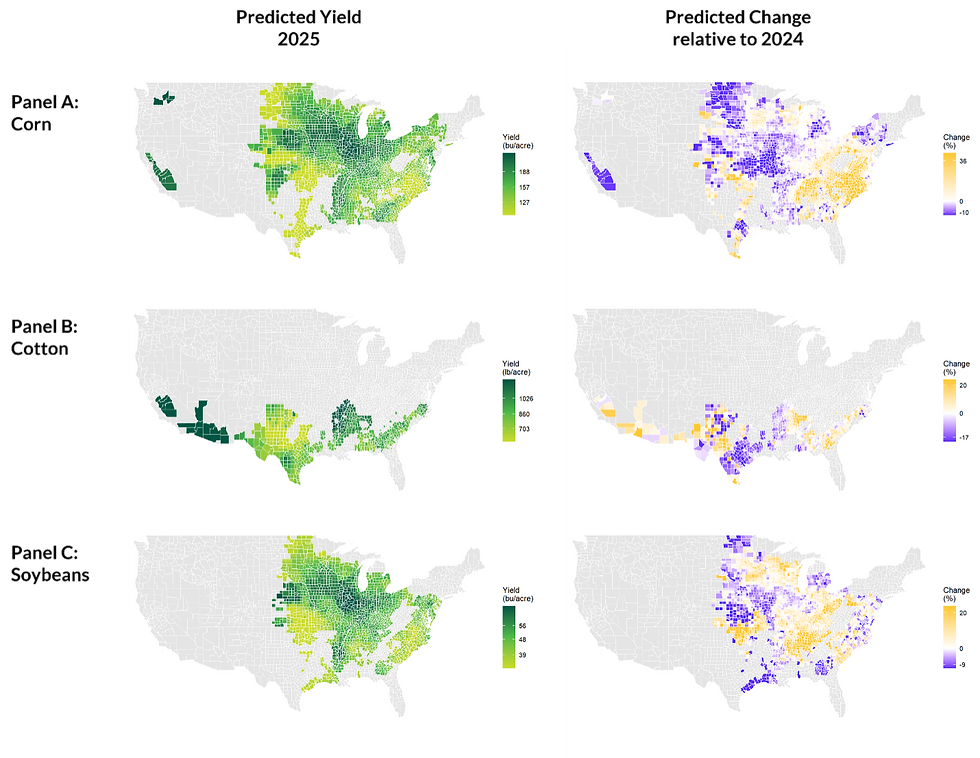
Source: Agricultural Risk Policy Center (ARPC), using data from the U.S. Department of Agriculture, National Agricultural Statistics Service (USDA NASS).
Because crop yields are a primary driver of aggregate supply, the geographic differences in 2025 yield expectations have potential implications for commodity prices and farmer revenues. In regions where yields are projected to rebound, stronger supply conditions may help stabilize markets and improve producer income, while areas facing expected declines may continue to experience tighter margins and elevated production risks. Incorporating these economic linkages into future work would provide a more comprehensive assessment of forecast implications.
Related Research and Policy Analysis by ARPC Economists:
Chakravorty R, Arita S, and Tsiboe F. Rising Costs, Falling Prices: Regional Disparities Deepen Farm Financial Stress. https://www.arpc-ndsu.com/post/rising-costs-falling-prices-regional-disparities-deepen-farm-financial-stress
Nalley L, Tsiboe F, Durand-Morat A, Shew A, Thoma G (2016) Economic and Environmental Impact of Rice Blast Pathogen (Magnaporthe oryzae) Alleviation in the United States. PLoS ONE 11(12): e0167295. https://doi.org/10.1371/journal.pone.0167295


Comments